The Technology of NLBS(Non-Performing Loan Bid System)
The technology provided here enables to match these people who want to sell a loan and those people who want to purchase a loan.The technology consist Non-Performing Loan Bid Market itself, which functions among economic units on net market.
Ⅰ Input Items for Deal
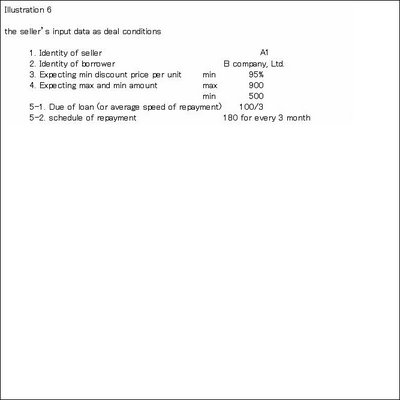
The followings are the seller’s input data as deal conditions. These data are the items of the deal.
1. The identity of the seller. Usually specified by name and it’s location.
2. The identity of the borrower. Usually specified by name and it’s location.
3. Maximum(hereinafter referred to as “max”) and minimum(hereinafter referred to as “min”) amount
4. Min discount price per unit
5. Due of loan(schedule of repayment, or average speed of repayment)
The followings are the purchaser’s input data as deal conditions. These data are also the items of the deal.
1. The identity of the purchaser. Usually specified by name and it’s location.
2. The identity of the borrower. Usually specified by name and it’s location.
3. Max and min amount
4. Max discount price per unit
5. Due of loan(schedule of repayment, or average speed of repayment)
Ⅱ Two Phases that Consists Deal
The process of deal is divided into two phases, first for seeking operation and second for bidding operation.
Seeking operation process is needed because by changing the input data by seller and by purchaser, seller and purchaser can seek and find out the whereabouts of counterpart’s conditions.
It’s a presupposition that the purchaser’s debt, which will be offset by the loan when acquired in the bidding operation, is fixed and will not be assigned, once after the purchaser enter the aforesaid bidding operation, till aforesaid bidding operation is over.
Ⅲ Functions of NLBS
Here, the basic functions of NLBS concerning above items is shown.
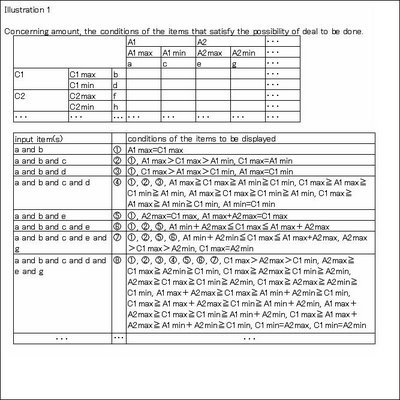
1. Max and Min Amount
NLBS can show the max and min amount that seller and purchaser want to sell or purchase at this seeking operation.
NLBS select and display to seller the amount which exceeds the seller’s min amount input by purchaser, and so do NLBS to seller the amount which is within the seller’s max amount input by purchaser. NLBS select and display to purchaser the amount which exceeds the purchaser’s min amount input by seller, and so do NLBS to purchaser the amount which is within the purchaser’s max amount input by seller.
In general, it’s possible to subdivide the amount of loan. And it’s also possible to integrate the amounts of loans. Illustration 1 is the logic for NLBS to show the possible deal between sellers and purchasers.

2. Discount Price per Unit
NLBS select and display to seller the discount price per unit which exceed the seller’s min discount price per unit input by purchaser, and so do NLBS to purchasers the discount price per unit which is within the purchaser’s max discount price per unit input by seller.
Seller and purchaser can decide the max and min discount price per unit they want to sell or purchase.
Illustration 2 is the logic for NLBS to show the possible deal between seller and purchaser.
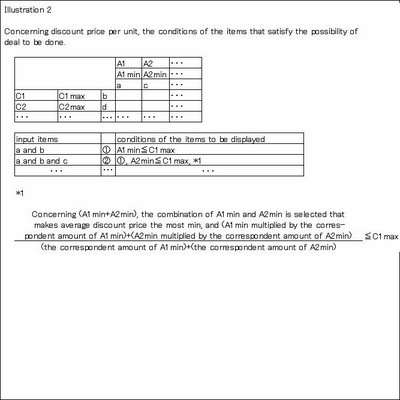
 Several sellers and purchasers who satisfy the equation Amin≦Cmax in average discount price per unit have the possibility for deal.
Here, we see how average min discount price per unit is calculated among two sellers A1 and A2 for single purchaser C1. This is the case *1 of ② on illustration 2.
As there exists two sellers A1 and A2, so each of them offers it’s own min discount price per unit.
Furthermore, let me explain by putting here an example as follows: A1min<A2min in discount price per unit, in amount A1min=90, A1max=100, in amount A2min=70, A2max=110, and in amount C1min=170 C1max=230. The detail is illustrated on illustration 3, on three dimension coordinates.
 First, the amount of the most min discount price per unit A1 is used till max 100(illustrated by solid line α), and then the amount of next most min discount price per unit A2 is used till 70(illustrated by solid line β). That makes 170, which A1min+A2min is the most min in discount price per unit. In this case, dealing should be done in amount from 170 to 210.
3. Speed of Repayment
NLBS can select, package and display the due and the amount of the seller that exceeds the speed of repayment input by purchaser. The sellers’ input of the exact schedule of each loan makes this possible. The logic is on Illustration 4.
 Let me explain further. Illustration 5 shows the average pitch of repayment which B owes to A.Straight line a, b and c show the average speed of repayment till max.
 The sharper the slope is, the faster the speed of repayment till max amount is. If the conditions of amount and discount price per unit are the same, the sharper the slope is, the more value the sharper slope has. The display by NLBS for straight line a is 100/3, for b is 100/9 and for c is 100/15.
NLBS hold the complete data of repayment schedule, therefore NLBS is able to display the required due. On illustration 5, straight line a, b and c show the average term needed to repay till max amount. In fact, for straight line c, the real repayment is sometimes curved as d or e. Let me put an example here as follows: When A1 hold loan 100 to B1, repayment speed is c but in fact the real repayment schedule is d, and A1 intend to sell in amount A1max=100, A1min=80. On the other hand C1 intend to purchase loan in amount C1max=80 and at repayment speed 100/12. In this case NLBS can show the point α to C1 on curbed d(in this case the repayment speed of the remainder is more flat, and it’s repayment start later than 9 month). On curbed e case, there is no point that NLBS can show to C1.
Ⅳ The Number of Participants
Regardless of any borrower, the number of participants changes for each side, according to the stage of bidding
In the early stage of dealing, there exists only purchasers’ offer. In the next stage, there comes the first seller’s offer. This process occurs in seeking operation. The first seller is to set up the first bidding operation of her or his own, and execute the bidding. The bidding is basically set up accordingly to each seller’s timing to enter the market. It’s up to each purchaser, whether she or he participate in the first bidding or wait till the next bidding by another seller.
Ⅴ Dealing Process
Let me put you in a picture of dealing process.
After the seller input the items of the deal, the seller’s display is as illustrated 6.
 At the seeking operation, the display for the seller is as illustrated 7.
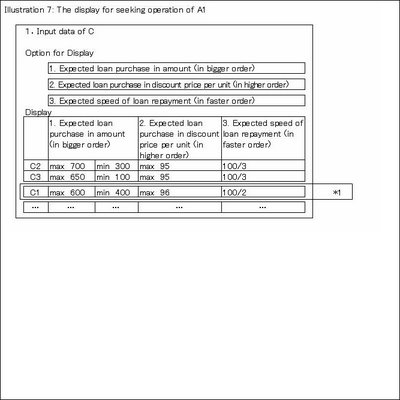
 These Cs that match the seller’s input conditions are displayed. In this case, C2 and C3 are displayed. When A1 alters the pitch of repayment from 100/3 to 100/2 in 3, C1 is newly displayed.
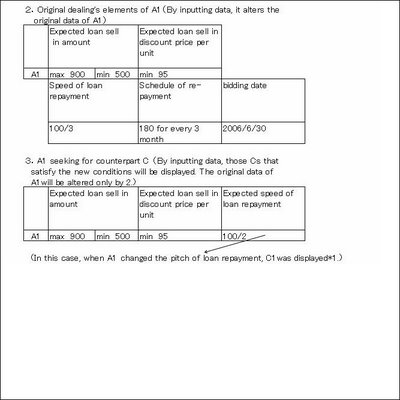
After the purchaser input the elements of the deal, the purchaser’s display is as illustrated 8.

At the seeking operation, the display for the purchaser is as illustrated 9.

 The A2 that match the purchaser’s input conditions are displayed. In this case, when C1 alters the pitch of repayment from 100/2 to 100/3 in 3, A1 is newly displayed.
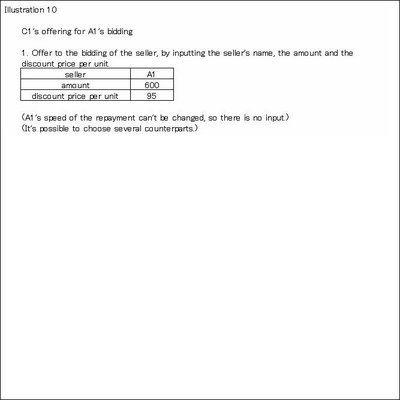
On illustration 10, C1 is offering to A1’s bidding. After all offers are done on bidding date, the highest bid price wins the bidding.
posted by yamada @ 6:50 AM
![]()
![]()

0 Comments:
Post a Comment
<< Home